
Why floods kill
The numbers, where they come from, why they disagree with each other, and the three sentences of NWS wording worth memorising exactly.
How many
The NWS puts it as a question, on a page written for the public: "So why does water kill 80 to 90 people (30 year average) annually in this country? Because the power of water is underestimated." That average covers 1994 to 2023.
You will see other numbers, and it is worth knowing why rather than assuming one of them is wrong. The annual hazard statistics count Flooding that begins within about six hours of whatever caused it, counted from the causative event rather than from when anyone noticed the water. The cause is usually intense rainfall, but a dam failure, a levee failure or an ice jam qualifies and can do it on a clear day. and river flood as separate categories, so a single-year flash flood count is not comparable to a combined flood average. Some campaign material quotes a single bad year. And fatalities that occur during a The general term for a tropical depression, tropical storm or hurricane. Their outer rainbands produce small, shallow supercells that are a recognised tornado threat well away from the centre. are filed under the hazard that killed the person, so hurricane rainfall deaths appear in the flood column and not the hurricane one.
How, and it is mostly cars
The NWS, citing the CDC: "The Centers for Disease Control and Prevention report that over half of all flood-related drownings occur when a vehicle is driven into hazardous flood water." NWS Little Rock puts the same point as "more than 50% of flood/flash flood related deaths occur in automobiles", and adds what comes second: "people walking into flooded areas".
The peer-reviewed basis is two papers and they are often conflated. Ashley and Ashley assembled the fatality dataset in 2008 and found a median of 81 flood deaths a year over 1959 to 2005, most of them from flash floods. The vehicle share comes from Terti and colleagues, who reanalysed that same dataset in 2017 and found 61% of the 1,075 fatalities were vehicle-related, or 63% of those whose circumstance was known. If you cite the 61%, cite Terti.
The The official national archive of significant weather events and their impacts, published by NOAA and built largely from local storm reports. It is the source almost every long-term severe weather statistic comes from. coding reinforces the point in a way that is easy to miss. Somebody who drives into floodwater, gets out of the car and then drowns is coded vehicle-related, not as a pedestrian. The decision that killed them was made at the water's edge with the engine running.
How little water it takes
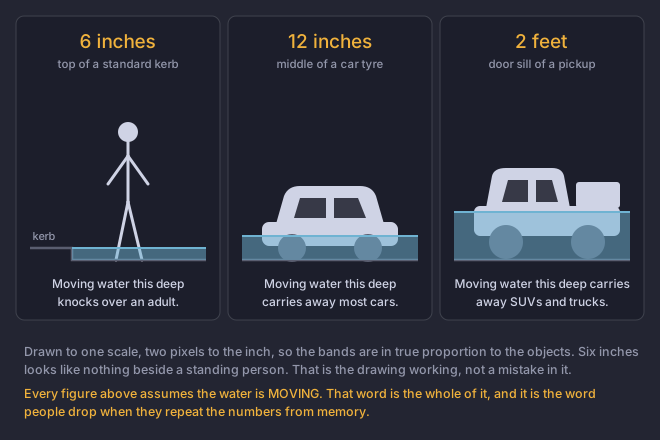
Three figures, in the NWS's exact wording. These are worth memorising verbatim, because they are the sentences you will end up repeating to somebody at a roadside:
A mere 6 inches of fast-moving flood water can knock over an adult.
It takes just 12 inches of rushing water to carry away most cars and
just 2 feet of rushing water can carry away SUVs and trucks.
The dark
The NWS: "Most deaths associated with floods occur either at night, or when people become trapped in automobiles that stall while driving in areas that are flooded." Every cue this course has taught you to use for depth needs light. At night a flooded road and a wet road look identical from a driver's seat, the kerb you would have measured against is underwater, and a washout where the roadbed has gone is completely invisible.
Add the warning gap from lesson 1: most flash flood warnings carry no damage-threat tag and therefore set off no phone. A base-tagged warning at three in the morning reaches almost nobody who is asleep. Nighttime flooding is the case where the hazard is at its worst and every one of the systems designed to tell you about it is at its weakest.
Turn Around Don't Drown
The campaign began in the early 2000s with Hector Guerrero, an NWS meteorologist in Texas, and is now run jointly by the NWS and the Federal Alliance for Safe Homes. The phrase is a registered trademark with a published usage policy, which matters if you are producing material for a spotter group: use it as written, with the trademark mark, and follow the NWS policy rather than making your own version.
The roadside signs follow federal highway standards, and the two shapes mean different things. Temporary signs are pink rectangles, deployed for a specific event. Permanent signs are yellow diamonds, and a permanent one marks a location that has flooded before and will again. A permanent sign is local flood history, posted.
Which statement is in the NWS's own wording, exactly as published?
Three numbers, in one sentence each: one for a person on foot, one for a car, one for a larger vehicle.Six inches of fast-moving water knocks over an adult, twelve inches carries away most cars, and two feet carries away SUVs and trucks. The wording specifies **moving** water throughout, which is the part people drop when they paraphrase it, and it is the part that decides whether the number applies.