
Velocity, and what it cannot see
Radar measures motion along the beam and nothing else. Everything confusing about the velocity display follows from that one sentence.
One component only
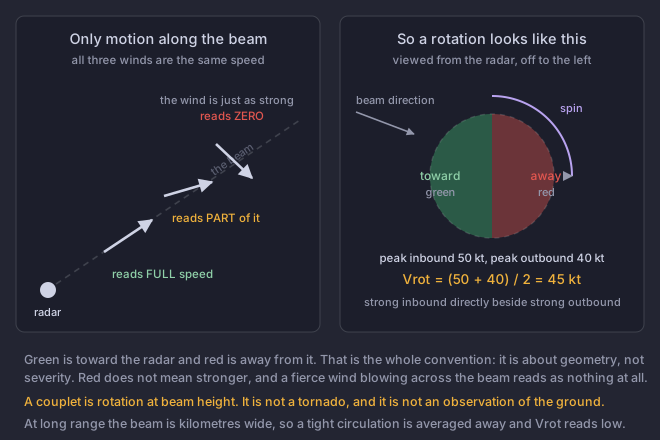
This is the whole lesson and everything else is consequence. The radar can only measure the part of a target's motion that is along the beam, toward it or away from it. Motion across the beam is completely invisible to it.
Base against storm-relative
- Base velocity
- What the radar measured: the ground-relative motion along the beam. Includes the storm bodily moving along, which on a fast-moving storm can dominate everything else.
- Storm-relative velocity
- The same field with the storm motion subtracted out. What is left is the circulation within the storm, which is what you actually want to look at. A rotation that is hidden in base The radar product showing how fast the rain, hail and debris in the beam are moving toward or away from the radar. Only motion along the beam is measured, and rotation shows up here as inbound and outbound speeds side by side. because the whole storm is racing along can be obvious in storm-relative.
Couplets
A rotating column, seen from the side by an instrument that can only measure along-beam motion, shows as strong inbound velocity immediately beside strong outbound velocity. That adjacency is the signature. Wide separation between the extremes is a broad circulation or none at all; tight adjacency between two adjacent radar samples is the thing forecasters call gate-to-gate Change of wind with height, measured as the difference between the wind at the top and bottom of a layer. It is not needed to make a thunderstorm and it decides almost everything about what kind you get..
Rotational velocity is the standard way to put a number on it: the average of the inbound and outbound peaks. If the strongest inbound is 50 knots and the strongest outbound is 40, the rotational velocity is 45 knots.
This course deliberately publishes no table converting rotational velocity to a damage rating. Those tables exist, they bin differently between studies, and nothing module 7 asks of a spotter requires estimating a damage rating from a radar app.
Three artifacts that fool people
- Velocity aliasing
- The radar can only measure speeds unambiguously up to a limit. Above it, the value wraps around and displays as a strong velocity of the opposite sign. The giveaway is an abrupt transition from extreme inbound to extreme outbound with no sensible values between, often in a patch rather than a tight couplet. Software usually corrects it and sometimes fails.
- Range folding
- Returns from beyond the unambiguous range assigned to the wrong distance, displayed as blocks of missing data, purple on many colour scales. Purple is absence of data, not severity. It is one of the more consequential misreadings in amateur use.
- The zero isodop
- The line through the display where the wind is blowing across the beam and the measured velocity is therefore zero. Its shape encodes how the wind turns with height, which is a forecaster skill. For a spotter it is worth recognising so it is not mistaken for a boundary or a feature in the storm.
A velocity display shows a tight pair of strong green and strong red pixels immediately adjacent, 90 km from the radar. What can you report?
Work out roughly how high the beam is at 90 km, using module 1 lesson 1.At 90 km the lowest beam is around 4,000 feet up, so a couplet there is a circulation most of a mile above the ground. It is a good reason to pay attention and it is not an observation of anything at the surface. The third option misreads the colour convention, which is about direction relative to the radar and nothing else.